

Most people look at an interest rate as a single number. It’s not. It’s a stack of risks, each one priced separately, layered on top of each other before a lender will hand over a dollar.
Once you understand what’s inside the number, you start to see why rates differ between a U.S. Treasury and a corporate bond, why longer loans cost more than shorter ones, and why the bond market has a remarkable track record of predicting economic slowdowns before they show up in the headlines.
Let’s break it down.
The risk-free rate
Every interest rate starts here. In the U.S., the baseline is the yield on short-term Treasury bills — what the government pays to borrow money for 90 days.
It’s called “risk-free” because lending to the U.S. government for 90 days carries essentially zero default risk. The government can always print dollars. You’re going to get paid back.
Strip out inflation and this real rate reflects the economy’s underlying growth capacity. In a normal environment it’s quite low — somewhere between 0.25% and 0.75%. It’s the floor. Every other rate in the economy is built on top of it.
The inflation premium
This is the biggest piece of the stack right now, and it’s the one most people feel directly.
If you lend someone $1,000 today and get paid back in 10 years, you need enough yield to offset the purchasing power you’re losing over that period. At 3% annual inflation, your $1,000 buys roughly $744 worth of goods a decade from now. The lender needs to be compensated for that.
The Fed’s official target is 2%. When inflation runs above that — as it has for the past several years — lenders demand more to compensate, and rates across the board move higher. This is the primary driver behind the rate environment we’re in today.
The term premium (duration risk)
Longer loans cost more, even from the same borrower.
A 10-year Treasury is riskier than a 2-year Treasury, despite both being backed by the U.S. government. More can go wrong over 10 years. Inflation can surprise. The economy can shift. If you lock up capital for a decade and rates rise, your bond is suddenly worth less than what you paid.
Investors demand extra yield for accepting that time commitment. That extra compensation is the term premium. On a 10-year instrument today, it adds roughly 1.5–1.6% to the yield.
This is also why the shape of the yield curve matters — which we’ll get to.
Credit risk
This is where the real pricing differences live.
A U.S. Treasury has no credit risk. The government doesn’t default on dollar-denominated debt. But when a corporation borrows money, investors face a real question: will they actually get paid back?
The answer gets priced into what’s called the “credit spread” — the extra yield above Treasuries that a borrower has to pay. The riskier the company, the wider the spread.
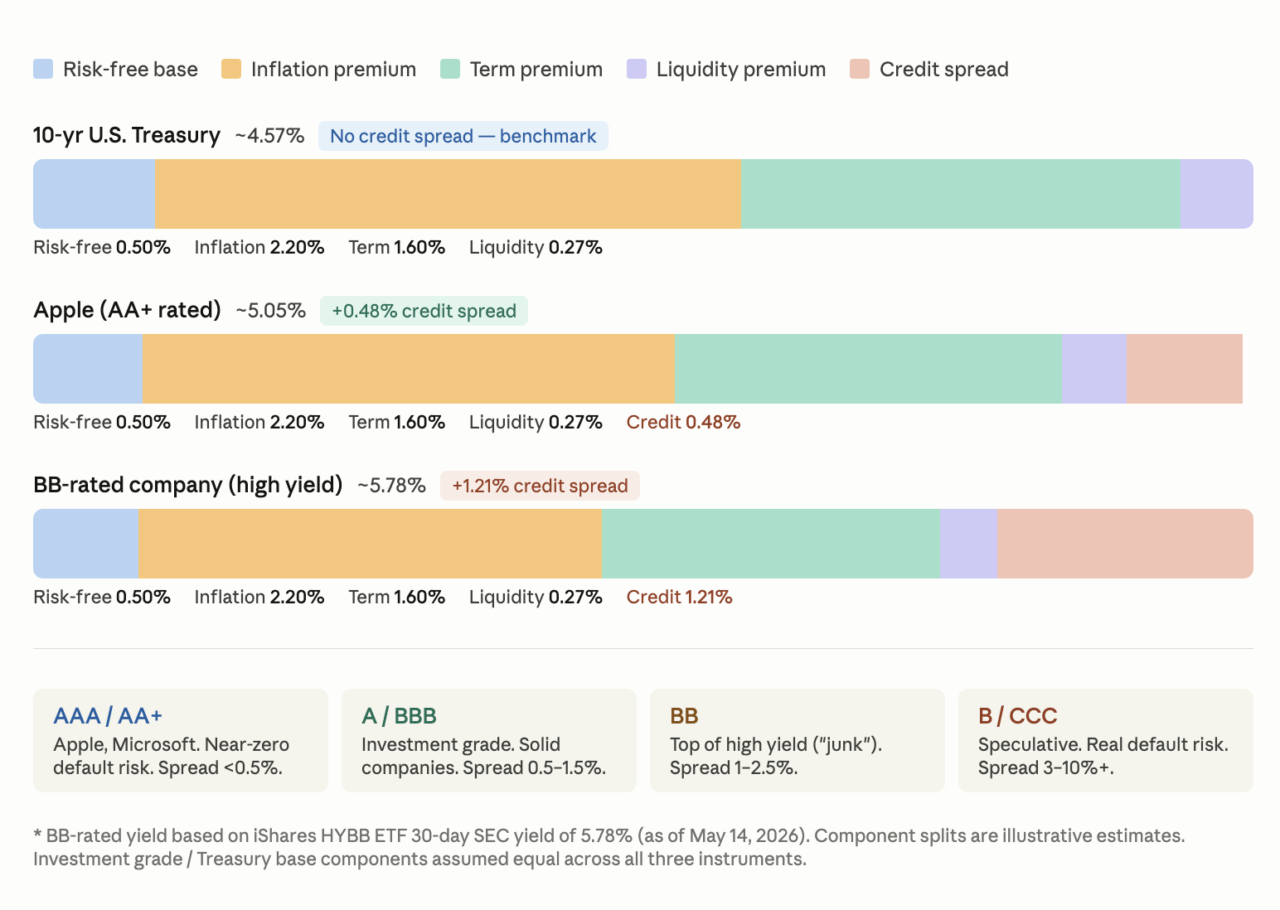
Apple carries a AA+ credit rating from S&P. It has over $60 billion in cash, generates roughly $100 billion in annual free cash flow, and has never defaulted. Investors treat its bonds almost like Treasuries. The spread over a 10-year Treasury is currently around 0.48%.
A BB-rated company — technically “high yield” or what the market used to call junk — carries a meaningfully higher risk of default. That same 10-year duration costs roughly 1.2% more than a Treasury, and for lower-rated issuers it can push to 4%, 6%, or higher.
The spread between investment grade and high yield bonds is also one of the better real-time gauges of economic confidence. When spreads tighten, the market is calm. When they widen suddenly, something is worrying investors.
The liquidity premium
A small but real piece of the stack that often gets overlooked.
U.S. Treasuries are the most liquid securities on the planet. You can sell $500 million in 10-year Treasuries before lunch. A corporate bond, even Apple’s, doesn’t trade with that kind of depth and immediacy.
When you lend to anyone other than the U.S. government, you accept some liquidity risk — the chance that if you need to sell before maturity, you might not find a buyer at the price you want. Investors charge a modest premium for that. On high-quality corporate paper it’s typically 0.2–0.3%. On illiquid private credit it can be considerably more.
The yield curve — and what happens when it inverts
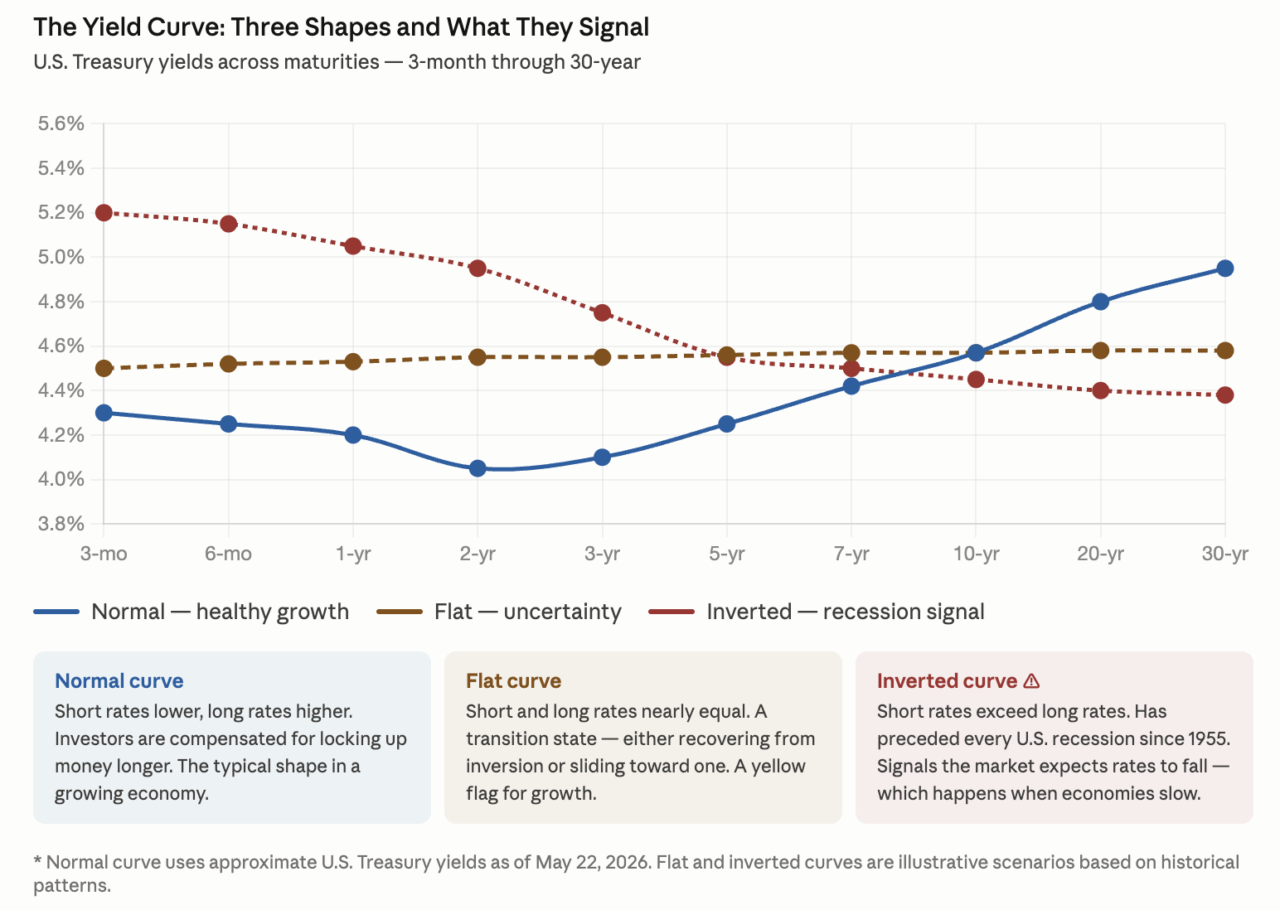
Plot Treasury yields from 3-month bills out to 30-year bonds and you get the yield curve. Under normal conditions it slopes upward — short-term rates lower, long-term rates higher. That’s the term premium doing its job.
But sometimes the curve flattens. And sometimes it inverts — meaning short-term rates are higher than long-term rates.
That’s unusual. And historically, it matters.
When the Fed raises short-term rates aggressively (typically to fight inflation), the short end of the curve gets pushed up. Long-term rates don’t always follow, because long rates are anchored more by where the market expects growth and inflation to be a decade from now. If investors believe the Fed is overdoing it — that the economy will eventually slow and rates will have to come back down — long-term yields can actually fall relative to short-term ones.
The result is an inverted curve. And it has preceded every U.S. recession since the mid-1950s without exception.
The mechanism makes intuitive sense. An inverted curve means investors are willing to accept less yield for 10 years than for 2 years — which only makes sense if they expect rates to fall significantly over that period. Rates fall when the economy weakens and the Fed responds. The bond market is essentially saying: this doesn’t last.
One important caveat: the curve predicts direction, not timing. The lag from inversion to recession has ranged from roughly 6 months to 2 years historically. It’s a warning, not a countdown timer.
Putting it together
Every interest rate you see — on a mortgage, a car loan, a corporate bond, a Treasury — is the sum of these components:
- Risk-free base rate — the floor, currently around 0.50%
- Inflation premium — compensation for purchasing power loss, currently around 2.20%
- Term premium — extra yield for duration risk, around 1.60% for 10 years
- Liquidity premium — the cost of reduced tradability, around 0.27% for corporate bonds
- Credit spread — default risk, from near zero (Apple) to 5%+ (distressed issuers)
The 10-year Treasury sits at roughly 4.57% today. Apple’s 10-year corporate bond adds about 0.48% for credit risk, landing near 5.05%. A BB-rated issuer adds 1.21% for credit risk, landing near 5.78%.
That spread, that difference, is the market putting a price on risk. When you understand what’s driving each component, you stop reading interest rates as background noise and start reading them as a real-time signal about the economy.
Next in Financial Fundamentals: The capital stack — how real estate and corporate deals are structured from senior debt through common equity, and why your position in that stack determines both your return and your risk.
